Click on the following link to run the Measure Your Gradient application:
Launch the Measure Your Gradient application
After clicking on the above link, a window will ask you to either open or save "measureyourgradientapp.jnlp". Make sure "Open with" and "Java(TM) Web Start Launcher" are selected and then click "Ok".
Note: Some browsers may open the contents of measureyourgradientapp.jnlp instead of running it. In that case, follow the instructions below for "Running Measure Your Gradient Offline".
Once the application launches, you will see the following window:

In this window, enter the following information:
1) Enter your column inner diameter and column length in millimeters.
2) Enter the flow rate you used along with the gradient program you ran.
3) Enter the instrument dead time/volume. The selection box next to the instrument dead time box lets you select whether you want to enter it as a time or as a volume. If you enter it as a time, be sure it is scaled correctly for the flow rate used in the gradient.
4) Enter the retention times you measured for each of the standards in the Measure Your Gradient test mix. You can manually enter in all the values, or you can click the "Find retention times automatically..." button to automatically extract the retention times from an mzXML, mzML, or netCDF file of the LC-MS run (see previous step).
Try it out! Right click the link below and select "Save link as..." to download an example mzXML file. It was acquired on a 2.1 x 100 mm column with a 0.4 mL/min flow rate in a gradient from 5% to 95% B in 10 min. The instrument dead time was 0.146 min.
 10mingradient.mzXML 10mingradient.mzXML
5) Click on the "Next Step" button. The window should now look something like this:

The top-left graph shows the ideal (programmed) gradient profile. The bottom-left graph shows the expected dead time (as measured by uracil) as a function of solvent composition. The table on the top-right shows the retention times you entered in the previous step (with the instrument dead time subtracted).
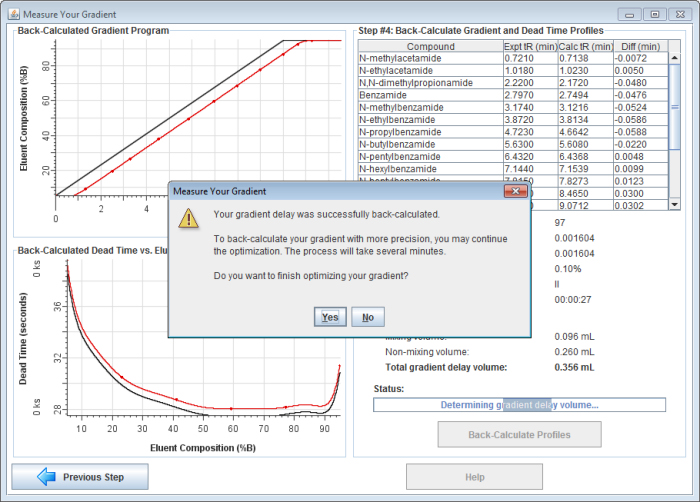
6) Click on the "Back-Calculate Profiles" button to begin back-calculating the gradient. First, the gradient delay is back-calculated. The gradient delay volume is the sum of all the volume in the tubing, connectors, and pump that is between the point where the solvent is proportioned and the column inlet. The gradient delay volume causes a delay between the time the HPLC pump is programmed to produce a certain solvent composition and when it actually reaches the column.
The gradient delay volume is split into two theoretical parts: mixing delay volume and non-mixing delay volume. One can think of mixing volume as a thoroughly mixed reservoir.

To understand its effect on the gradient profile, consider a gradient in which the fraction of solvent B increases linearly over the course of the experiment. As eluent with a higher amount of solvent B enters the mixing volume, it mixes with eluent of a lower solvent B fraction left over in the mixer. This causes the gradient profile reaching the column to not only be delayed, but also rounded, or dispersed.

One can think of non-mixing volume as an open tube where a significant volume of eluent resides, but does not mix as it moves through it (of course, under laminar flow conditions it actually does mix to some degree as it moves through an open tube, but for this illustration, we ignore it). The following figure shows the effect of 1 mL mixing volume or 1 mL non-mixing volume on a gradient profile run at a flow rate of 1 mL/min.

7) After back-calculating your gradient delay volume, the software will ask if you would like to continue back-calculating your gradient.

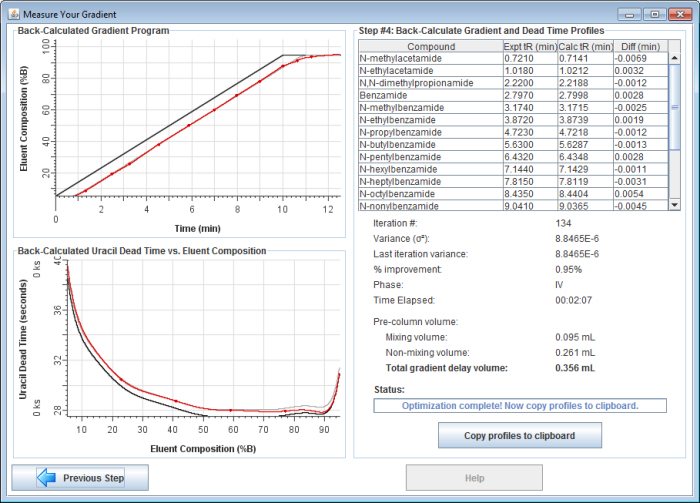
If you choose to continue, the application will back-calculate your gradient profile with greater precision. It will allow the gradient profile to take on any shape (not just a dispersed and/or delayed gradient), enabling it to account for solvent mis-proportioning. It usually takes 3-10 minutes to complete the final gradient optimization.

8) Copy and paste a report into spreadsheet software. Once finished, click on the "Copy profiles to clipboard" button to copy a report to the clipboard. Then you can paste the report into your favorite spreadsheet software.
|
